I'm
Data Analyst
Hi, I’m Jaideep Patil, a passionate Data Analyst who loves turning raw data into meaningful stories.
I work with SQL, Python, Power BI, and Excel to clean, analyze, and visualize data that supports better decisions.
I enjoy building interactive dashboards, writing advanced SQL queries, and uncovering trends hidden in data.
My projects span retail, e-commerce, and streaming platforms, including Walmart, Netflix, and Spotify analyses.
I focus on data accuracy, clear KPIs, and strong visual storytelling.
Comfortable with databases and ETL processes, I bridge technical analysis with business needs.
Always curious and continuously learning to grow as a modern, impact-driven data analyst.
Name:Jaideep Patil.
Date of Birth:07 Oct 2000
Location:Vadodara,Gujarat
Email:jaideeppatil100@gmail.com
Phone:+91 8668790672
TOPS Technologies,Vadodara
Feb 2025 – Sept 2025 | Vadodara
📊 Data Analyst Intern
• Applied data analysis skills on real-world projects involving data analysis, database design, and dashboard creation.
• Built a Library Management System with ER diagrams and reports for efficient book issue and return tracking.
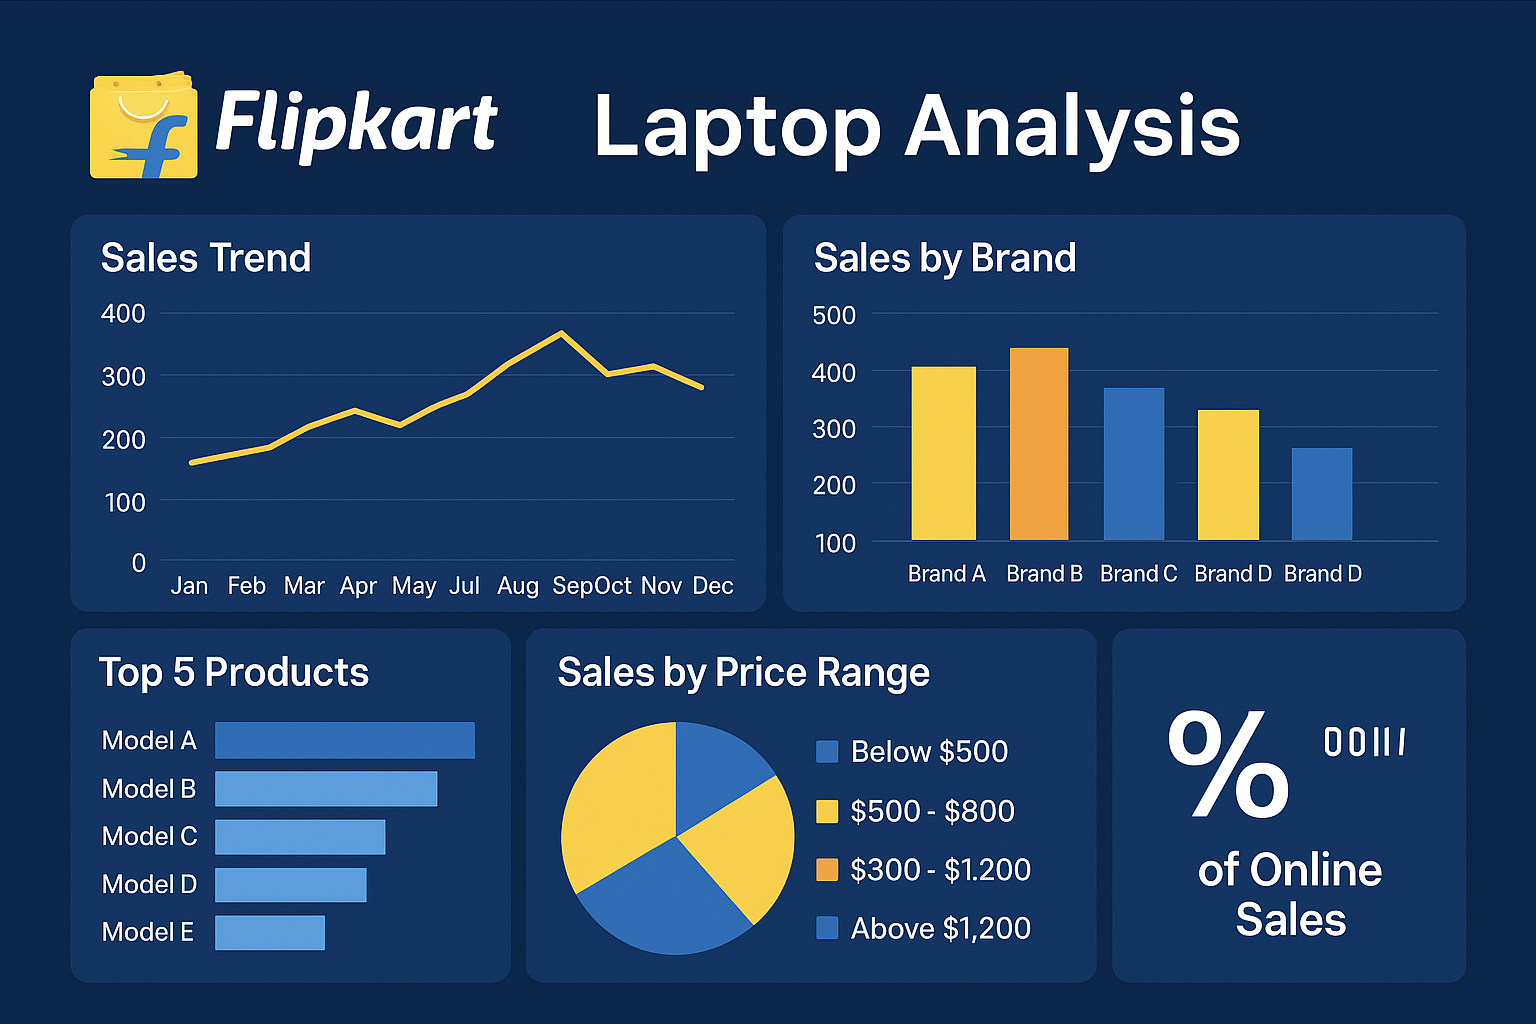
• Performed Flipkart Laptop Analysis using web scraping and Power BI to uncover pricing trends and brand insights.
• Used SQL, Python, Power BI, and Excel for data cleaning, analysis, and visualization.
• Demonstrated strong analytical thinking, problem-solving skills, and attention to detail.
Course
TOPS Technologies,Vadodara
Feb 2025 – Sept 2025 | Vadodara